FAU research model predicts COVID outbreaks, shows effectiveness of safety procedures
Researchers from the FAU College of Engineering and Computer Science created a new model to predict COVID outbreaks two weeks before they occur.

Photo by Eston Parker III
August 12, 2021
A new model created by a team of researchers at FAU’s College of Engineering and Computer Science can predict COVID-19 outbreaks two weeks before they occur.
The research team consisted of Murtadha D. Hssayeni, Arjuna Chala, Roger Dev, Lili Xu, Borko Furht, and Behnaz Ghoraani.
The model tracks people’s social behavior by watching their mobility. Once the mobility is tracked through Google Community Mobility Reports and the Bureau of Transportation Statistics, the model can project a COVID outbreak based on how much movement one area experienced.
“An increase in mobility shows an increase in the interaction between people, especially in areas with high population density. Therefore, feeding the mobility data to epidemiological forecasting models helps to estimate COVID-19 growth as well as evaluating the effects of government policies such as mandating masks on the spread of COVID-19,” Behnaz Ghoraani, associate professor in the Department of Electrical Engineering and Computer Science and a fellow of the FAU Institute for Sensing and Embedded Network Systems Engineering said for FAU News Desk.
Not only does the model predict outbreaks, but it also evaluates how effective federal and state safety procedures are.
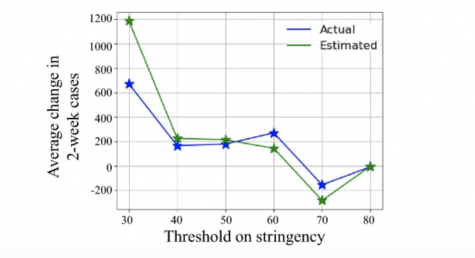
“Change in lockdown policies, mask mandates, and other government responses directly impact the daily COVID-19 cases. Hence, the model predictions of the 2-week daily cases have to reflect that impact as shown by the actual accumulated 2-week cases,” the study stated.
Researchers established a system of levels to measure how stringent, or strict, federal safety policies were. Then, they recorded the change in cases within a month-long period and plotted the data.
“As we can observe from these plots, a higher stringency index decreased the cases,” the study said.